Key Indicators to Analyze Bitcoin Price Trends

Understanding Bitcoin’s price trends doesn’t have to be overwhelming. Using a combination of indicators can give you valuable insights into market conditions and help you make better decisions. This guide covers important tools like RSI, MVRV-Z, Pi Cycle Top Indicator, Fear & Greed Index, and others, with practical tips for using them effectively.
Momentum and Sentiment Indicators
RSI (Relative Strength Index)
RSI evaluates whether Bitcoin is overbought or oversold on a scale of 0 to 100.
• Below 30: Indicates oversold conditions, often a signal for a potential price rebound.
• Above 70: Indicates overbought conditions, suggesting a potential price drop.
Practical Tip: Use RSI to time short-term trades, especially during extreme market conditions.
Fear & Greed Index
This index measures market sentiment using factors like volatility, volume, and social media activity, providing a score from 0 to 100.
• Below 25 (Fear): Suggests buying opportunities during market panic.
• Above 75 (Greed): Signals caution, as the market may be overheated.
Practical Tip: Monitor this index daily to gauge overall market sentiment and adjust your strategy accordingly.
Stochastic RSI
This momentum indicator refines RSI by highlighting extreme overbought or oversold conditions.
• Above 80: Market is overbought, indicating potential price drops.
• Below 20: Market is oversold, signaling potential recovery.
Practical Tip: Combine Stochastic RSI with other indicators to confirm entry or exit points.
On-Chain Indicators
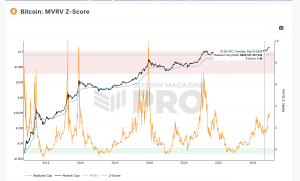
MVRV-Z Score
The MVRV-Z score compares Bitcoin’s market value to its realized value, revealing extremes in valuation.
• Below 0: Undervalued, often a good buying opportunity.
• Above 7: Overvalued, signaling a potential correction.
Practical Tip: Use this for long-term investment decisions, especially when values are near historical extremes.
Hash Ribbons
Hash Ribbons monitor miner activity by tracking hash rate drops and recoveries.
• Recovery signals often indicate the end of miner capitulation and a favorable buying zone.
Practical Tip: Watch for recovery signals as they often align with strong accumulation phases.
Net Unrealized Profit/Loss (NUPL)
This indicator shows whether Bitcoin holders are in profit or loss.
• Below 0: Indicates fear and potential buying opportunities.
• Above 0.5: Reflects euphoria, signaling caution or profit-taking.
Practical Tip: Buy during fear (below 0) and consider selling or reducing exposure during euphoria (above 0.5).
Cycle Indicators
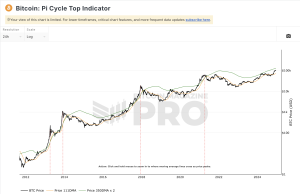
Pi Cycle Top Indicator
This tool predicts market peaks by tracking the 111-day and 350-day moving averages.
• When these lines cross, it often marks a market top.
Practical Tip: Use this to identify when to take profits during bull markets.
Puell Multiple
This indicator measures miner revenue to find market extremes.
• Low values: Suggest market bottoms and buying opportunities.
• High values: Indicate overheated markets, signaling caution or selling.
Practical Tip: Combine this with other indicators like MVRV-Z or Fear & Greed to confirm signals.
Trend Indicators
200-Week Moving Average
This is a long-term support level that has historically marked Bitcoin’s market bottoms.
• Bitcoin’s price rarely stays below this level for long, making it a strong buy zone.
Practical Tip: Use this as a benchmark for long-term accumulation during bear markets.
Parabolic SAR
Parabolic SAR places dots above or below the price to show trend direction.
• Dots below indicate an uptrend; dots above indicate a downtrend.
Practical Tip: Use this to confirm trends rather than to predict reversals.
Volume-Based Indicators
On-Balance Volume (OBV)
OBV measures buying and selling pressure using trading volume.
• Rising OBV alongside price suggests strong momentum.
• Diverging OBV and price can signal reversals.
Practical Tip: Monitor OBV to confirm whether a price trend is supported by strong trading activity.
Funding Rates
In perpetual futures, funding rates indicate market sentiment.
• Positive rates suggest bullish sentiment.
• Negative rates suggest bearish sentiment.
Practical Tip: Extreme funding rates can signal market exhaustion and potential reversals.
Combining Indicators for Better Decisions
When to Buy
• Look for fear in the Fear & Greed Index (below 25), RSI below 30, or MVRV-Z near or below 0.
• Watch for recovery signals in Hash Ribbons or low values in the Puell Multiple.
When to Sell
• Watch for greed in the Fear & Greed Index (above 75), RSI above 70, or MVRV-Z above 7.
• A Pi Cycle Top signal or high Puell Multiple values often indicate a market peak.
For Long-Term Investing
• Use the 200-week moving average and MVRV-Z score to identify undervalued zones for accumulation.
For Short-Term Trading
• Combine RSI, Stochastic RSI, and Fear & Greed Index for precise entry and exit points.
Conclusion
By using indicators like RSI, MVRV-Z, Pi Cycle Top, and Fear & Greed Index along with tools such as Hash Ribbons, OBV, and the 200-week moving average, you can better navigate Bitcoin’s price movements. While no single indicator is foolproof, combining them gives a clearer picture of market conditions, helping you make smarter trading and investing decisions. Always consider broader market trends and manage your risk carefully.


