Realizing Bitcoin’s Price Patterns
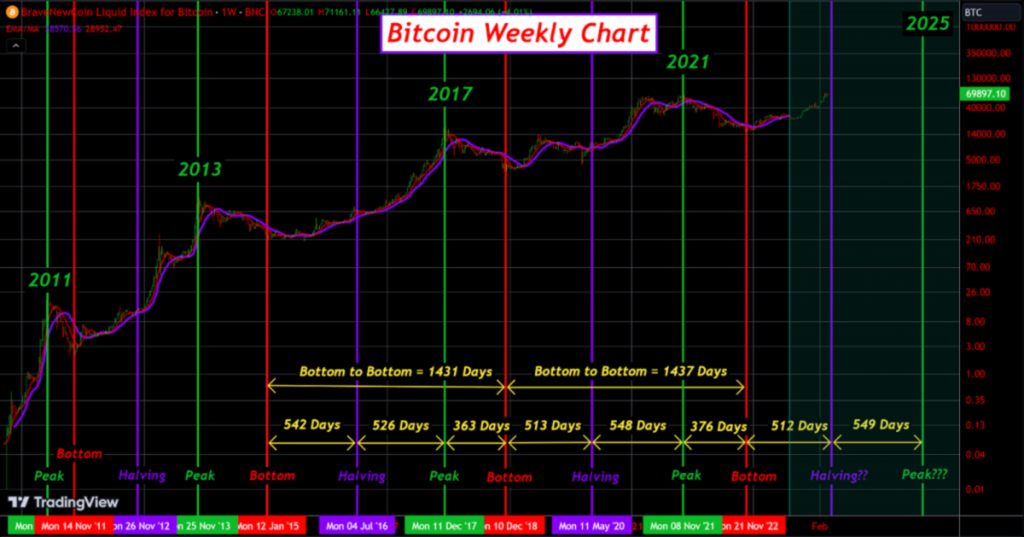
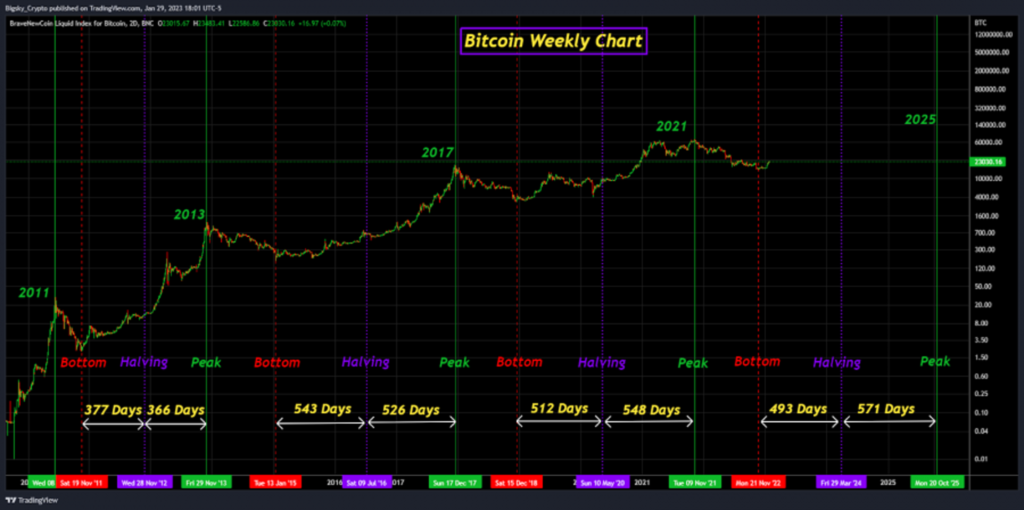
Bitcoin has had a rollercoaster ride since its inception, with its value reaching new heights before often dropping significantly. Observing Bitcoin’s market cycles over time reveals a pattern, particularly with cycles following the first one showing a consistency in timing.
The most recent cycles suggest a nearly four-year period from one peak to another and from one low point to the next. This timing coincides with the Bitcoin halving event, which occurs roughly every four years, leading to speculation about whether there’s a connection between the two.
Bitcoin’s Journey Through Market Cycles

Bitcoin’s journey began in 2010, and since then, it has gone through several significant cycles:
- 2010 to 2011: Marked the beginning of Bitcoin’s price tracking, with a peak in June 2011.
- 2011 to 2015: Featured a recovery and a peak in April 2013, followed by another peak in November 2013.
- 2015 to 2018: Saw Bitcoin’s price climbing to just under $20,000 in December 2017.
- 2018 to 2022: Included a dramatic increase and a peak in April 2021, with the cycle apparently ending in November 2022.
These cycles suggest a pattern, potentially linked to the Bitcoin halving, leading to speculation about future market behavior, particularly in 2024 and beyond.
The Influence of Bitcoin Halving
The halving event, which reduces the number of new bitcoins created, is believed to impact Bitcoin’s price, with historical data suggesting a correlation between halvings and subsequent price increases. As we approach the next halving, there’s curiosity about whether the patterns observed in past cycles will continue or evolve.
Changing Dynamics in the Bitcoin Market

The Bitcoin market is evolving, with increased institutional investment and the introduction of Bitcoin exchange-traded funds (ETFs) potentially affecting future cycles. This change in investor demographics might lead to less volatile bear market pullbacks, altering the overall market cycle dynamics.
Bitcoin’s Market Condition in 2024
In 2024, Bitcoin’s behavior has defied past patterns, with prices reaching new highs before the halving. This could indicate a shift in market dynamics, possibly rendering the four-year cycle theory less relevant. The market might be adjusting to the halving event earlier than in previous cycles, or we could be witnessing a breakdown of the cycle theory altogether.
Conclusion
Bitcoin’s price history shows a pattern of peaks and troughs, with speculation about the influence of the halving event on these cycles. As the market evolves, with more institutional investors and new financial products, it remains to be seen how Bitcoin’s price dynamics will change. The coming years will be crucial in understanding whether the observed four-year cycle will continue or if new patterns will emerge.


