The Pi Cycle Top Indicator: A Signal for Bitcoin Market Peaks

The Pi Cycle Top Indicator: A Signal for Bitcoin Market Peaks
Predicting Bitcoin’s market cycles is a challenging task, but certain tools have emerged to help investors identify critical turning points. One such tool is the Pi Cycle Top Indicator, which has gained popularity for its ability to historically pinpoint Bitcoin’s price peaks with remarkable accuracy.
What is the Pi Cycle Top Indicator?
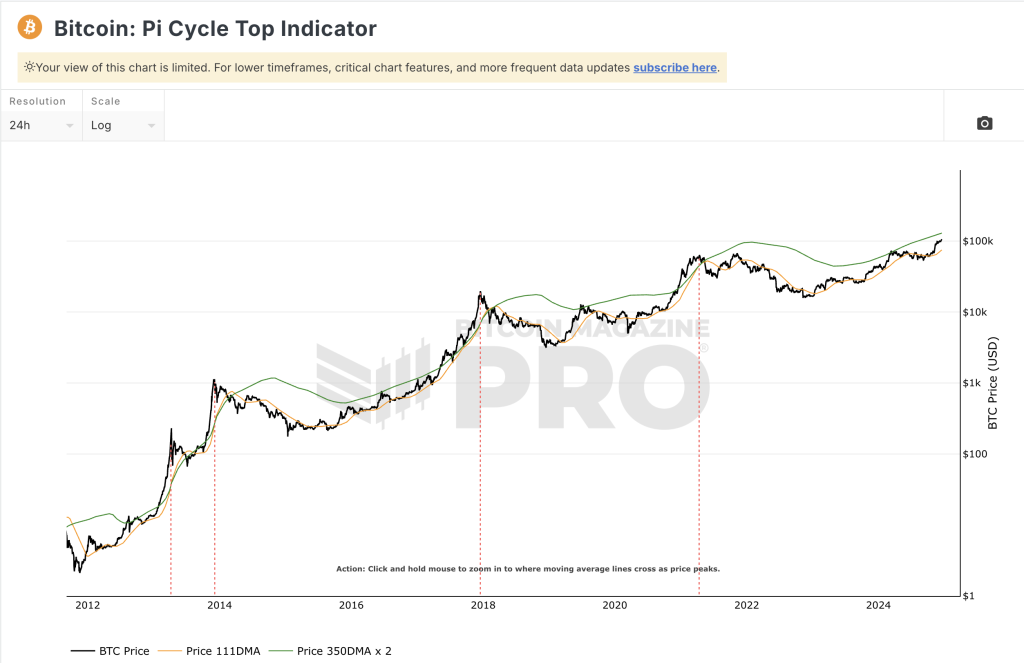
The Pi Cycle Top Indicator is a technical analysis tool designed to identify potential market tops in Bitcoin’s price cycle. It uses a combination of two moving averages (MAs) to track the momentum of Bitcoin’s price over time:
1. 111-Day Moving Average (111DMA):
• A shorter-term trendline reflecting the average closing price of Bitcoin over the past 111 days.
2. 350-Day Moving Average (350DMA) Multiplied by 2 (350DMA x 2):
• A longer-term trendline, adjusted by doubling the standard 350-day moving average.
The indicator generates a “top signal” when the 111-day moving average crosses above the 350-day moving average multiplied by 2. Historically, this crossover has coincided with Bitcoin’s market cycle tops.
How Does It Work?
The Pi Cycle Top Indicator is based on the observation that market tops are often driven by parabolic price increases followed by sharp corrections. The indicator captures the rapid acceleration in Bitcoin’s price during these phases, signaling when the market may be overheated.
• When the 111DMA moves above the 350DMA x 2, it indicates excessive bullish momentum and a potential market top.
• Conversely, when the lines diverge after the crossover, it may signal the start of a market cooldown or correction.
Historical Accuracy
The Pi Cycle Top Indicator has a strong track record of identifying Bitcoin’s market cycle tops:
1. 2013 Bull Market:
• The indicator successfully predicted both market peaks in April and November during Bitcoin’s double bull run.
2. 2017 Bull Market:
• The Pi Cycle Top Indicator signaled the market top in December 2017, shortly before Bitcoin’s price began a significant decline from $20,000.
3. 2021 Bull Market:
• The indicator marked the April 2021 top when Bitcoin reached around $64,000, followed by a sharp correction. Although Bitcoin hit a new all-time high in November 2021, this was considered a secondary peak.
Why Is It Useful?
The Pi Cycle Top Indicator is valuable for several reasons:
1. Identifying Euphoria:
• It helps investors recognize when the market may be entering a phase of irrational exuberance, often characterized by unsustainable price increases.
2. Profit-Taking Opportunities:
• By signaling potential market tops, the indicator can help long-term investors and traders decide when to secure profits.
3. Avoiding FOMO:
• The tool reduces emotional decision-making by providing a data-driven approach to understanding market cycles.
Limitations of the Pi Cycle Top Indicator
While the Pi Cycle Top Indicator has been historically accurate, it is not infallible. Investors should be aware of its limitations:
1. False Signals:
• Although rare, the indicator could generate a false positive or fail to predict a market top, especially in highly volatile or atypical market conditions.
2. Lagging Nature:
• The crossover signal typically occurs after the actual peak, meaning it is best used as a confirmation tool rather than a proactive trigger.
3. Secondary Peaks:
• In cases like 2021, the indicator may miss subsequent market tops, as it is calibrated for single, dominant peaks.
4. No Bottom Prediction:
• The Pi Cycle Top Indicator is specifically designed to signal tops and does not provide insights into market bottoms.
Where to Track the Pi Cycle Top Indicator
Investors can track the Pi Cycle Top Indicator and its live chart on Bitcoin Magazine Pro’s dedicated page. This resource offers real-time updates, allowing users to monitor the indicator’s status and anticipate potential market movements.
Conclusion
The Pi Cycle Top Indicator is a powerful tool for understanding Bitcoin’s market cycles and spotting potential peaks. By analyzing the relationship between the 111DMA and the 350DMA x 2, the indicator offers a clear, data-driven approach to identifying overheated market conditions.
While it should not be relied upon in isolation, the Pi Cycle Top Indicator can be a valuable addition to any investor’s toolkit when used alongside other metrics and market research. To stay ahead in the ever-evolving crypto market, consider regularly monitoring the indicator’s status here.
By combining historical insights with current market data, the Pi Cycle Top Indicator helps investors navigate Bitcoin’s dynamic price cycles with greater confidence.


